Following the Money 2016
How the 50 States Rate in Providing Online Access to Government Spending Data
State governments spend hundreds of billions of dollars each year through contracts for goods and services, subsidies to encourage economic development, and other expenditures. Public accountability helps ensure that state funds are spent as wisely as possible. State-operated spending transparency websites provide checkbook-level detail on government spending, allowing citizens and watchdog groups to view payments made to individual companies, the goods or services purchased, and the benefits obtained in exchange for public subsidies. All 50 states operate websites to make information on state expenditures accessible to the public, and in the past year these web portals continued to improve. For instance, all but four states provide checkbook-level data for one or more economic development subsidy programs and more than half of states make that subsidy data available for researchers to download and analyze.
Downloads
Executive Summary
State governments spend hundreds of billions of dollars each year through contracts for goods and services, subsidies to encourage economic development, and other expenditures. Public accountability helps ensure that state funds are spent as wisely as possible.
State-operated spending transparency websites provide checkbook-level detail on government spending, allowing citizens and watchdog groups to view payments made to individual companies, the goods or services purchased, and the benefits obtained in exchange for public subsidies.
All 50 states operate websites to make information on state expenditures accessible to the public, and in the past year these web portals continued to improve. For instance, all but four states provide checkbook-level data for one or more economic development subsidy programs and more than half of states make that subsidy data available for researchers to download and analyze.
This seventh annual evaluation of state transparency websites finds that states continue to make progress toward comprehensive, one-stop, one-click transparency and accountability for state government spending. In 2015, several states launched new and improved websites to better open the books on public spending, or have adopted new practices to further expand citizens’ access to critical spending information. Several states, however, continue to lag behind. (See Figure ES-1 and Table ES-1.)
Figure ES-1. How the 50 States Rate in Providing Online Access to Government Spending Data
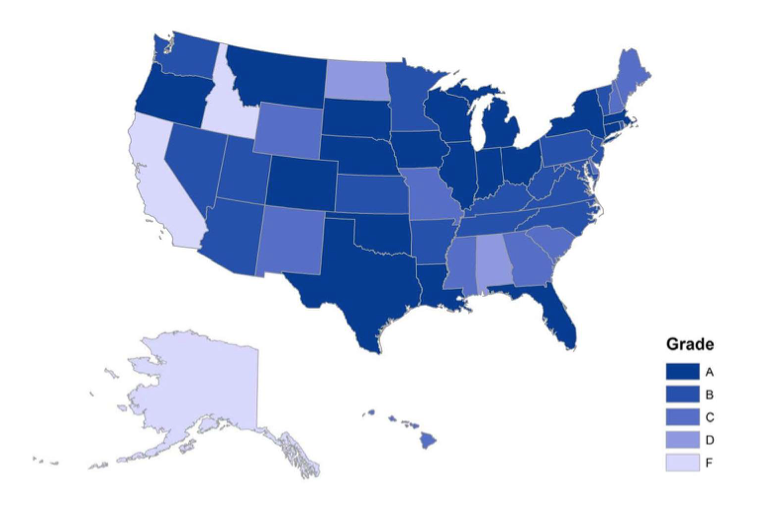
Table ES-1: Top 10 and Bottom 10 States in Providing Online Access to Government Spending Data
|
Top 10 States |
Grade |
Score* |
Rank |
Bottom 10 States |
Grade |
Score |
Rank |
|
|
Ohio |
A+ |
100 |
1 |
California |
F |
34 |
50 |
|
|
Michigan |
A+ |
100 |
2 |
Alaska |
F |
43 |
49 |
|
|
Indiana |
A+ |
100 |
3 |
Idaho |
F |
45 |
48 |
|
|
Oregon |
A+ |
100 |
4 |
Alabama |
D+ |
60 |
47 |
|
|
Connecticut |
A+ |
99 |
5 |
North Dakota |
D+ |
64 |
46 |
|
|
Wisconsin |
A |
97 |
6 |
Delaware |
C+ |
77 |
44 |
|
|
Louisiana |
A |
96 |
7 |
Hawaii |
C |
71 |
45 |
|
|
Florida |
A |
96 |
8 |
Wyoming |
C |
73 |
43 |
|
|
Massachusetts |
A |
95.5 |
9 |
Georgia |
C |
74 |
42 |
|
|
Iowa |
A- |
94.5 |
10 |
Maine |
C+ |
76 |
41 |
* Though the top four states all scored 100 points, their scores were different when calculated without extra credit points, allowing each to be assigned a different rank. Louisiana is ranked higher than Florida, based on this same method.
Transparency Websites Should Be Comprehensive, One-Stop and One-Click
|
Transparency Standards |
|
Comprehensive: A user-friendly web portal provides residents the ability to search detailed information about government contracts, spending, subsidies and tax expenditures for all government entities. |
|
One-Stop: Residents can search all government expenditures on a single website. |
|
One-Click Searchable and Downloadable: Residents can search data with a single query or browse common-sense categories. Residents can sort data on government spending by recipient, amount, legislative district, granting agency, purpose or keyword. Residents can also download data to conduct detailed off-line analyses. |
Confirmation of Findings with State Officials
To ensure that the information presented here is accurate and up to date, our researchers sent initial assessments and a list of questions to transparency website officials in all 50 states and received feedback from 43 states. State transparency officials were given the opportunity to verify information, clarify their online features, and discuss the benefits of transparency best practices in their states. For a list of the questions posed to state officials, please see Appendix C.
Several states have made substantive upgrades to their transparency sites or added new features that give the public unprecedented ability to monitor how their government allocates resources. Of particular note:
- Michigan streamlined its transparency data and added functionality to its transparency website, including allowing bulk download of all its data.
- West Virginia launched a new site with data on projected and actual public benefits of the state’s major subsidy programs.
- Utah and Arizona have joined several other states in adding data from localities, municipalities and school districts to their state transparency portals. This provides an inexpensive way to improve the transparency of the spending that often affects ordinary citizens most directly.
- Indiana, Minnesota, Nebraska, New Hampshire and Washington now prominently feature data on quasi-public entities with web pages dedicated solely to these agencies, boards, authorities and commissions.
States have made varying levels of progress toward improved online spending transparency.
- Leading States (“A” range): The number of Leading States has risen to 18, an all-time high. These states offer easy-to-use websites with data on an array of expenditures. Visitors can find information on specific vendor payments, and experts and watchdog groups can download and analyze the entire checkbook dataset.
- Advancing States (“B” range): Seventeen states are advancing in online spending transparency, with spending information that is easy to access but more limited than spending information provided by Leading States. Most Advancing States have checkbooks that are searchable by recipient, keyword and agency.
- Middling States (“C” range): Ten states are middling in online spending transparency, with comprehensive and easy-to-access checkbook-level spending information but limited information on subsidies or other “off-budget” expenditures.
- Lagging States (“D” range): The two Lagging States fail to provide tax expenditure reports and provide almost no checkbook-level detail on the recipients of economic development subsidies.
- Failing States (“F” range): Three states fail to meet several of the basic standards of online spending transparency. For example, two of the three (Alaska and California) do not host an online database for searching or viewing expenditure details, and only one makes tax expenditure reports available via a central transparency portal. None of the Failing States provide any information on economic development subsidies.
All states, including Leading States, have opportunities to improve their transparency.
- Only 11 states provide checkbook-level information that includes the recipients of each of the state’s most important subsidy programs. While many other states provide checkbook-level information for some of their major subsidy programs, disclosure for all programs would provide greater transparency and accountability.
- The checkbooks in four states (Alaska, California, Idaho and Maryland) have limited online searchability.
- Six states (Alabama, California, Idaho, Missouri, North Dakota and Wyoming) do not provide tax expenditure reports that detail the impact on the state budget of targeted tax credits, exemptions or deductions.
- No state provides a comprehensive list of government entities outside the standard state budget. Ideally, all governmental and quasi-governmental entities – even those that are entirely financially self-supporting – would integrate their expenditures into the online checkbook, and a central registry of all such entities would be available for public reference. Some states provide comprehensive information on quasi-public agencies, but other entities like special districts are still excluded.
- Even top-scoring states should continue to expand the universe of data accounted for by their transparency portals. Important advancements would include supporting municipal- and county-level transparency, public-private partnerships and special districts, and making those data available centrally.
- Most websites fail to match the user-friendliness and intuitiveness common to Americans’ everyday experience of the Internet, including, for example, the ability to easily compare data sets or graphs.
Table ES-1: How the 50 States Rate in Providing Online Access to Government Spending Data
|
State |
Grade |
Score |
|
Alabama |
D+ |
60 |
|
Alaska |
F |
43 |
|
Arizona |
B |
86 |
|
Arkansas |
B- |
82 |
|
California |
F |
34 |
|
Colorado |
A- |
93.5 |
|
Connecticut |
A+ |
99 |
|
Delaware |
C+ |
77 |
|
Florida |
A |
96 |
|
Georgia |
C |
74 |
|
Hawaii |
C |
71 |
|
Idaho |
F |
45 |
|
Illinois |
A- |
93 |
|
Indiana |
A+ |
100 |
|
Iowa |
A- |
94.5 |
|
Kansas |
B |
84 |
|
Kentucky |
B+ |
88 |
|
Louisiana |
A |
96 |
|
Maine |
C+ |
76 |
|
Maryland |
B+ |
88 |
|
Massachusetts |
A |
95.5 |
|
Michigan |
A+ |
100 |
|
Minnesota |
B |
86 |
|
Mississippi |
C+ |
79 |
|
Missouri |
C+ |
77 |
|
Montana |
A- |
92 |
|
Nebraska |
A- |
90 |
|
Nevada |
B |
83 |
|
New Hampshire |
C+ |
78 |
|
New Jersey |
B |
83 |
|
New Mexico |
C+ |
77 |
|
New York |
A- |
93 |
|
North Carolina |
B+ |
89.5 |
|
North Dakota |
D+ |
64 |
|
Ohio |
A+ |
100 |
|
Oklahoma |
A- |
90.5 |
|
Oregon |
A+ |
100 |
|
Pennsylvania |
B |
83 |
|
Rhode Island |
B- |
81.5 |
|
South Carolina |
C+ |
78 |
|
South Dakota |
A- |
90 |
|
Tennessee |
B |
85.5 |
|
Texas |
A- |
93.5 |
|
Utah |
B+ |
88 |
|
Vermont |
B+ |
88 |
|
Virginia |
B- |
82 |
|
Washington |
B+ |
87 |
|
West Virginia |
B |
83 |
|
Wisconsin |
A |
97 |
|
Wyoming |
C |
73 |